
Visualize project planning and execution
Although many tracking tools and various plugins help visualize dependencies between tasks, they often come with drawbacks such as requiring payment, lacking essential features, or having an unattractive UI.
In the projects I lead, I prefer using a tool called Excalidraw. While it is just a board, I find it great for illustrating dependencies and the current state of the project.
Here is a simple example of planning the delivery of a new microservice to staging. Different colors distinguish the work areas.
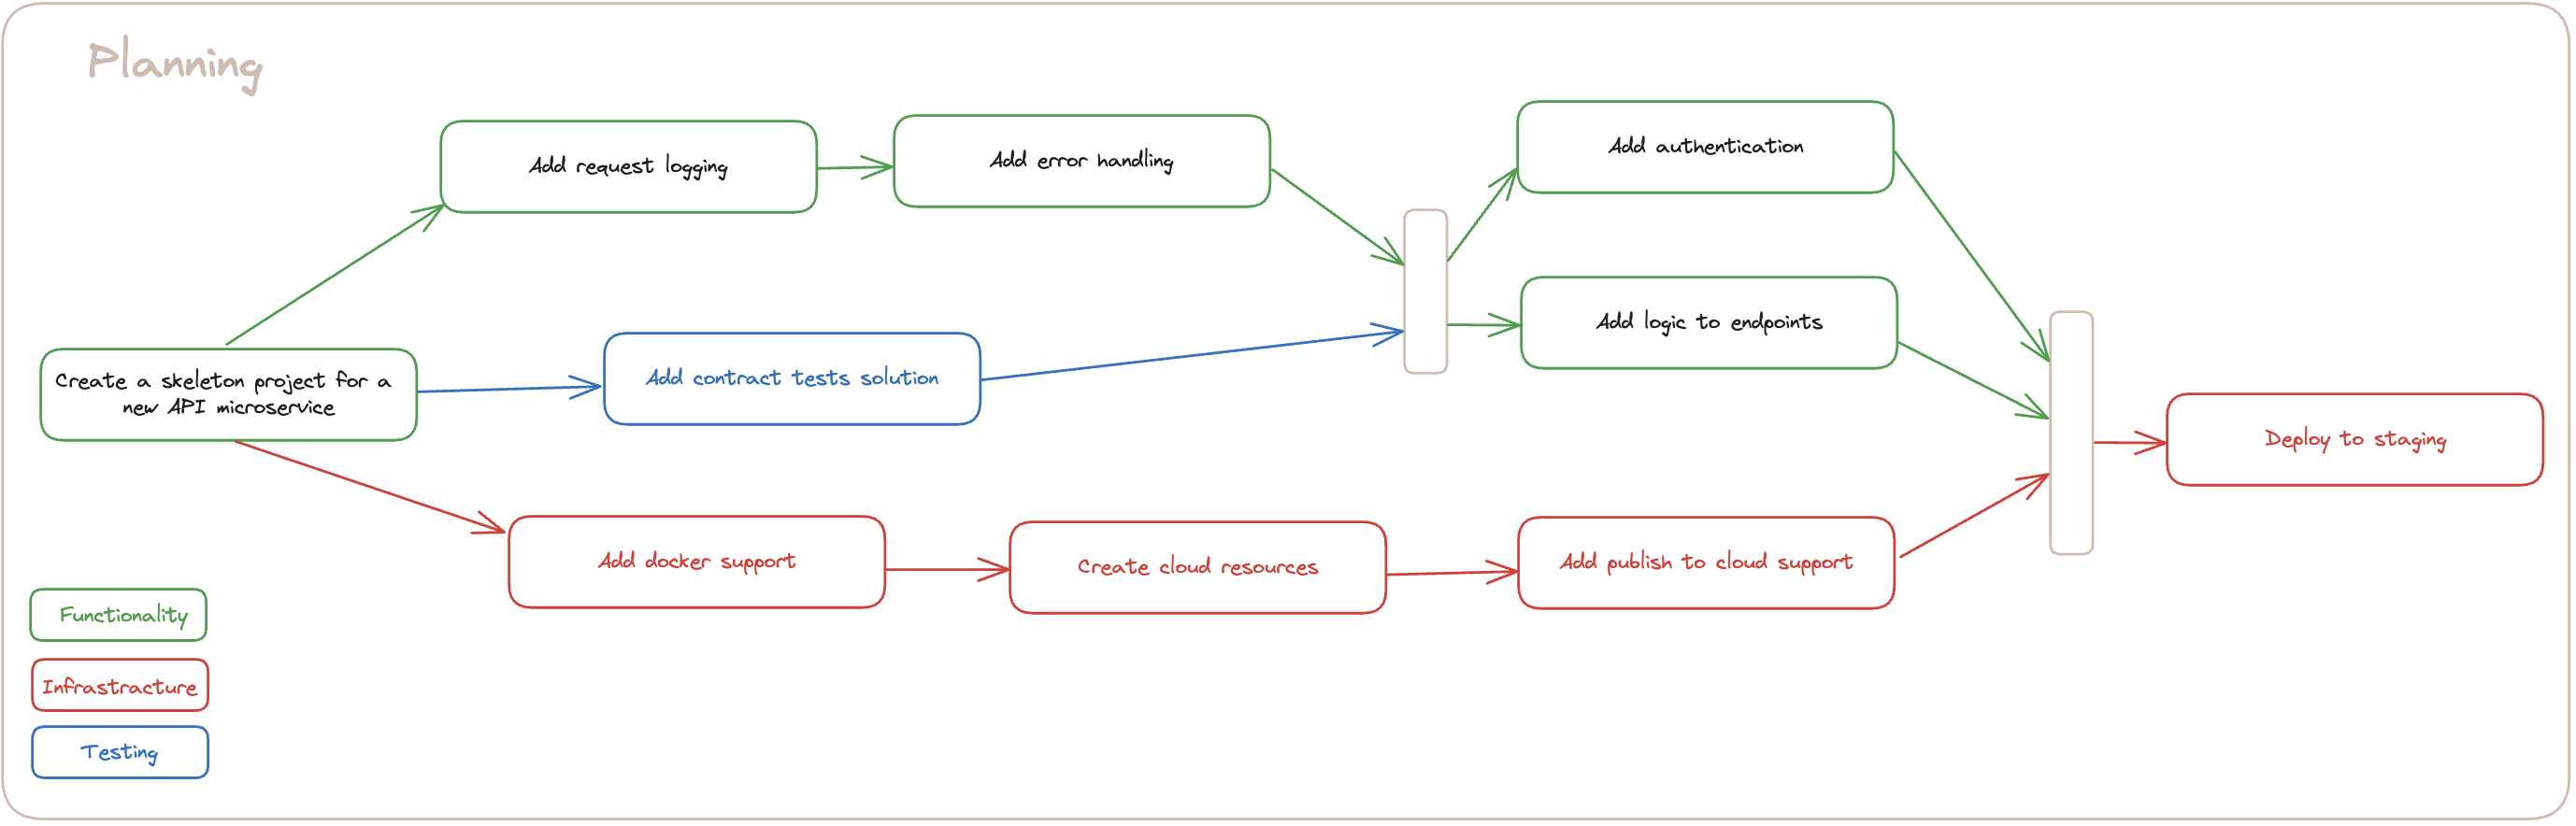
I use an approach similar to Petri nets, where tasks represent places and transitions indicate the work that must be completed before moving to the next step.
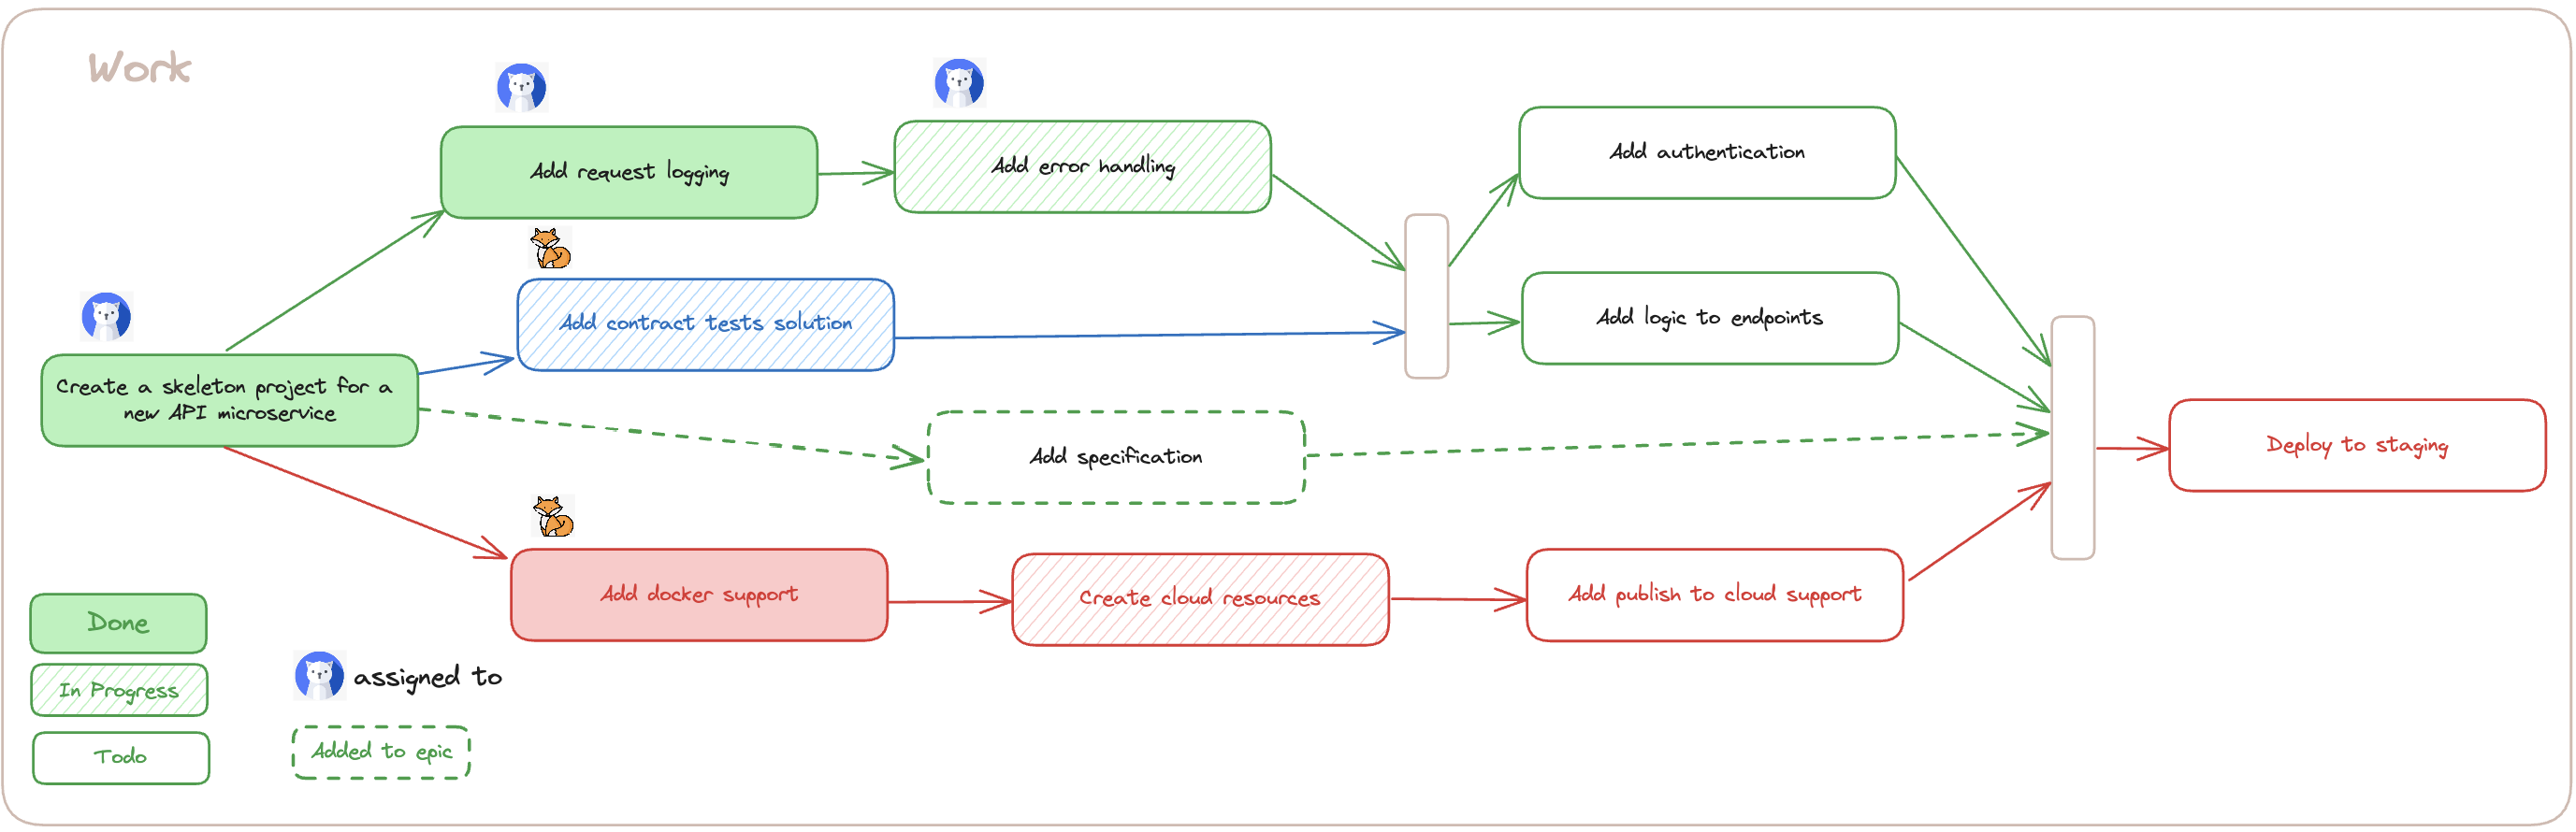
New issues can be added during the process. The current state is determined by the filling type, allowing you to see the progress at any point. Additionally, you might include helpful information to align the work.
Comments